Grundlæggende statistik
| Institutionelle ejere | 181 total, 177 long only, 0 short only, 4 long/short - change of 2,14% MRQ |
| Gennemsnitlig porteføljeallokering | 0.3079 % - change of 33,05% MRQ |
| Institutionelle aktier (lange) | 313.821.891 (ex 13D/G) - change of 2,70MM shares 0,70% MRQ |
| Institutionel værdi (lang) | $ 1.146.104 USD ($1000) |
Institutionelt ejerskab og aktionærer
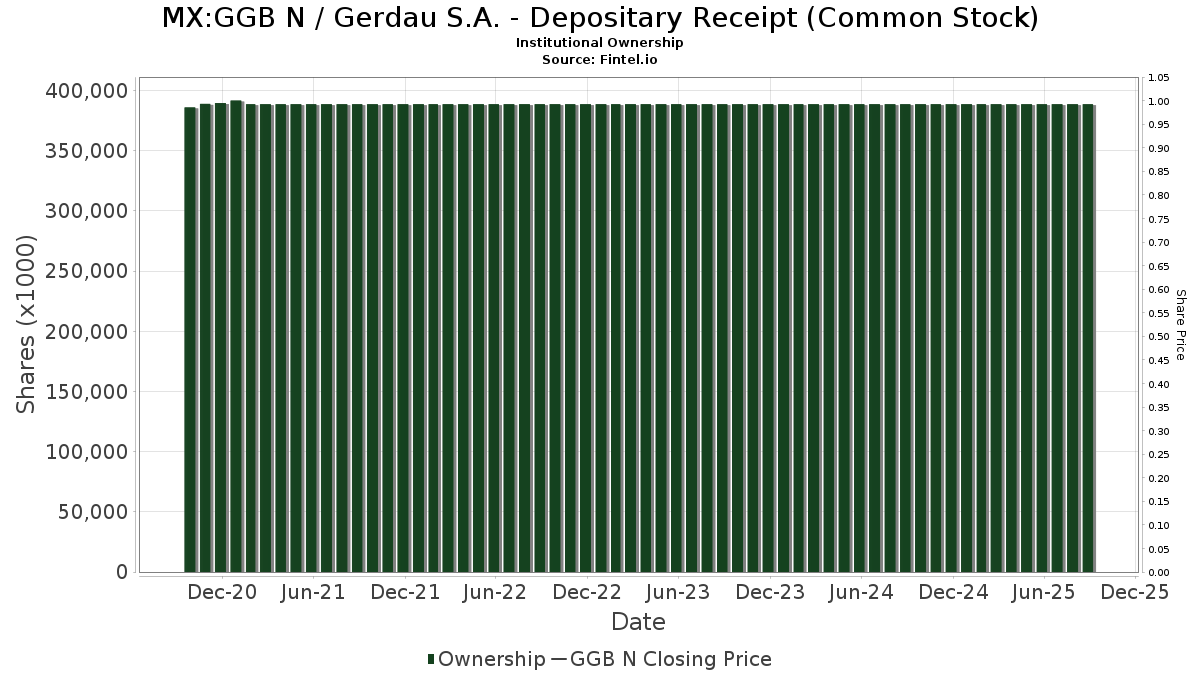
Gerdau S.A. - Depositary Receipt (Common Stock) (MX:GGB N) har 181 institutionelle ejere og aktionærer, der har indsendt 13D/G- eller 13F-formularer til Securities Exchange Commission (SEC). Disse institutioner har i alt 313,821,891 aktier. Største aktionærer omfatter Fmr Llc, Capital International Investors, Donald Smith & Co., Inc., Aquamarine Financial (Cayman) Ltd, Contrarian Capital Management, L.l.c., Dimensional Fund Advisors Lp, Itau Unibanco Holding S.A., Causeway Capital Management Llc, BlackRock, Inc., and Renaissance Technologies Llc .
Gerdau S.A. - Depositary Receipt (Common Stock) (BMV:GGB N) institutionel ejerskabsstruktur viser aktuelle positioner i virksomheden efter institutioner og fonde, samt seneste ændringer i positionsstørrelse. Større aktionærer kan omfatte individuelle investorer, investeringsforeninger, hedgefonde eller institutioner. Skema 13D angiver, at investoren besidder (eller besidder) mere end 5 % af virksomheden og har til hensigt (eller har til hensigt at) aktivt at forfølge en ændring i forretningsstrategi. Skema 13G indikerer en passiv investering på over 5%.
Fondens stemningsscore
Fund Sentiment Score (fka Ownership Accumulation Score) finder de aktier, der bliver mest købt af fonde. Det er resultatet af en sofistikeret, multi-faktor kvantitativ model, der identificerer virksomheder med de højeste niveauer af institutionel akkumulering. Scoringsmodellen bruger en kombination af den samlede stigning i oplyste ejere, ændringerne i porteføljeallokeringer i disse ejere og andre målinger. Tallet går fra 0 til 100, hvor højere tal indikerer et højere niveau af akkumulering for sine jævnaldrende, og 50 er gennemsnittet.
Opdateringsfrekvens: Dagligt
Se Ownership Explorer, som giver en liste over højest rangerende virksomheder.
AI+ Ask Fintel’s AI assistant about Gerdau S.A. - Depositary Receipt (Common Stock).
Select a question to share a public post with an AI-crafted answer.
Thinking of good questions…
13F og NPORT arkivering
Detaljer om 13F-arkivering er gratis. Detaljer om NP-ansøgninger kræver et premium-medlemskab. Grønne rækker angiver nye positioner. Røde rækker angiver lukkede positioner. Klik på linket ikon for at se den fulde transaktionshistorik.
Opgrader
for at låse premium-data op og eksportere til Excel ![]() .
.
| Fil dato | Kilde | Investor | Type | Gennemsnitlig pris (Øst) |
Aktier | Δ Aktier (%) |
Rapporteret Værdi ($1000) |
Δ Værdi (%) |
Port Alloc (%) |
|
|---|---|---|---|---|---|---|---|---|---|---|
| 2025-12-02 | 13F | IFP Advisors, Inc | 0 | 0 | ||||||
| 2026-02-13 | 13F | Flow Traders U.s. Llc | 65.056 | 0 | ||||||
| 2026-02-17 | 13F | Amundi | 1.359.223 | 3,03 | 5.016 | 16,63 | ||||
| 2026-02-12 | 13F | BlackRock, Inc. | 7.067.528 | 0,92 | 26.079 | 20,13 | ||||
| 2026-02-06 | 13F | Gsa Capital Partners Llp | 140.640 | -55,55 | 1 | |||||
| 2026-02-23 | 13F | Virtu Financial LLC | 119.006 | -71,96 | 0 | -100,00 | ||||
| 2026-02-06 | 13F | Plan A Wealth LLC | 17.944 | 12,88 | 66 | 34,69 | ||||
| 2026-02-13 | 13F | Marshall Wace, Llp | 0 | -100,00 | 0 | |||||
| 2025-11-14 | 13F | AXA Investment Managers S.A. | 1.024.392 | 3.176 | ||||||
| 2026-02-03 | 13F | Virtus Family Office LLC | 574.870 | -0,03 | 2.121 | 19,02 | ||||
| 2026-02-13 | 13F | Johnson Investment Counsel Inc | 0 | -100,00 | 0 | |||||
| 2025-11-13 | 13F | Employees Retirement System of Texas | 0 | -100,00 | 0 | |||||
| 2026-02-13 | 13F | Ubs Asset Management Americas Inc | 134.021 | -93,27 | 495 | -91,99 | ||||
| 2026-02-17 | 13F | Susquehanna International Group, Llp | Call | 18.500 | 68 | |||||
| 2026-02-17 | 13F | Citadel Advisors Llc | 6.067.900 | 202,18 | 22.391 | 259,74 | ||||
| 2026-02-17 | 13F | Susquehanna International Group, Llp | 298.309 | -61,17 | 1.101 | -53,80 | ||||
| 2026-02-17 | 13F | Susquehanna International Group, Llp | Put | 10.400 | 38 | |||||
| 2026-02-10 | 13F | Quantbot Technologies LP | 269.554 | -30,96 | 995 | -17,85 | ||||
| 2025-11-14 | 13F | Axa S.a. | 0 | -100,00 | 0 | -100,00 | ||||
| 2026-01-26 | 13F | Cwm, Llc | 237 | 0,00 | 0 | |||||
| 2026-02-12 | 13F | Hrt Financial Lp | 0 | -100,00 | 0 | |||||
| 2026-02-13 | 13F | BNP Paribas Asset Management Holding S.A. | 1.024.392 | 4 | ||||||
| 2026-03-06 | 13F | Hsbc Holdings Plc | 822.772 | 3,42 | 3.036 | 23,11 | ||||
| 2026-02-13 | 13F | Causeway Capital Management Llc | 7.259.433 | 0,98 | 26.787 | 20,20 | ||||
| 2026-02-11 | 13F | Capital International Sarl | 934.528 | -1,84 | 3.448 | 16,84 | ||||
| 2026-02-17 | 13F | Hartree Partners, LP | 0 | -100,00 | 0 | |||||
| 2026-02-17 | 13F | Magnetar Financial LLC | 34.114 | 126 | ||||||
| 2026-02-12 | 13F | Ci Investments Inc. | 317.443 | 0,00 | 1.171 | |||||
| 2026-02-03 | 13F/A | Mount Yale Investment Advisors, LLC | 0 | -100,00 | 0 | |||||
| 2026-02-17 | 13F | Grantham, Mayo, Van Otterloo & Co. LLC | 586.191 | -8,60 | 2.163 | 8,80 | ||||
| 2026-01-30 | 13F | Bogart Wealth, LLC | 344 | 1 | ||||||
| 2026-02-13 | 13F | Citigroup Inc | 105.671 | -5,02 | 390 | 13,08 | ||||
| 2026-02-17 | 13F | D. E. Shaw & Co., Inc. | 1.615.446 | -48,98 | 5.961 | -39,28 | ||||
| 2026-02-13 | 13F | Brooklands Fund Management Ltd | Call | 0 | -100,00 | 0 | ||||
| 2026-02-13 | 13F | Kcm Investment Advisors Llc | 14.576 | 0,00 | 54 | 17,78 | ||||
| 2026-02-02 | 13F | Truist Financial Corp | 103.153 | 0,65 | 381 | 19,87 | ||||
| 2026-02-11 | 13F | Capital International Inc /ca/ | 210.637 | -2,56 | 777 | 15,97 | ||||
| 2026-02-09 | 13F | Hantz Financial Services, Inc. | 261 | 0 | ||||||
| 2026-02-12 | 13F | Quadrant Capital Group Llc | 46.894 | 0,00 | 173 | 19,31 | ||||
| 2026-02-13 | 13F | Mml Investors Services, Llc | 12.374 | 23,38 | 46 | 45,16 | ||||
| 2026-02-11 | 13F | Simplex Trading, Llc | Put | 100 | -95,24 | 0 | ||||
| 2026-02-04 | 13F | Money Concepts Capital Corp | 38.430 | 0,00 | 142 | 18,49 | ||||
| 2026-02-11 | 13F | Simplex Trading, Llc | 1.254 | -76,16 | 5 | |||||
| 2026-02-02 | 13F | Strs Ohio | 221.039 | -14,87 | 816 | 1,37 | ||||
| 2026-02-17 | 13F | FIL Ltd | 2.544.394 | -16,37 | 9.389 | -0,46 | ||||
| 2025-11-14 | 13F | Credit Agricole S A | 0 | -100,00 | 0 | |||||
| 2026-02-11 | 13F | Franklin Resources Inc | 14.666 | 0,36 | 54 | 20,00 | ||||
| 2026-02-12 | 13F | Xponance, Inc. | 20.570 | 16,05 | 76 | 38,89 | ||||
| 2026-02-17 | 13F | Mercer Global Advisors Inc /adv | 11.890 | -24,49 | 44 | -10,42 | ||||
| 2025-09-29 | NP | ECOW - Pacer Emerging Markets Cash Cows 100 ETF | 159.740 | 480 | ||||||
| 2026-01-27 | 13F | Fractal Investments LLC | 33.264 | 0,00 | 123 | 18,45 | ||||
| 2026-01-21 | 13F | Yousif Capital Management, Llc | 22.284 | 0,00 | 93 | 33,33 | ||||
| 2026-02-17 | 13F | Tower Research Capital LLC (TRC) | 1.054 | -32,69 | 4 | -25,00 | ||||
| 2026-02-17 | 13F | Quadrature Capital Ltd | 784.361 | 2.894 | ||||||
| 2026-02-06 | 13F | Profund Advisors Llc | 33.635 | 29,41 | 124 | 55,00 | ||||
| 2026-02-04 | 13F | Argos Wealth Advisors, LLC | 14.757 | 54 | ||||||
| 2025-11-13 | 13F | Tradition Wealth Management, LLC | 0 | -100,00 | 0 | |||||
| 2026-02-19 | 13F | Invesco Ltd. | 286.302 | 5,20 | 1.056 | 25,27 | ||||
| 2026-02-03 | 13F | Crossmark Global Holdings, Inc. | 74.784 | 0,00 | 276 | 19,05 | ||||
| 2026-02-13 | 13F | Ieq Capital, Llc | 11.116 | -3,27 | 41 | 17,14 | ||||
| 2026-02-06 | 13F | EverSource Wealth Advisors, LLC | 8.401 | -12,39 | 31 | 3,45 | ||||
| 2026-02-03 | 13F | We Are One Seven, LLC | 11.532 | 10,43 | 43 | 31,25 | ||||
| 2025-11-10 | 13F | Pekin Hardy Strauss, Inc. | 0 | -100,00 | 0 | -100,00 | ||||
| 2026-02-09 | 13F | MQS Management LLC | 0 | -100,00 | 0 | |||||
| 2026-02-17 | 13F | Engineers Gate Manager LP | 47.879 | -97,06 | 177 | -96,51 | ||||
| 2026-02-10 | 13F | Ritter Daniher Financial Advisory LLC / DE | 2.135 | 8 | ||||||
| 2025-10-08 | 13F/A | New York State Common Retirement Fund | 0 | -100,00 | 0 | -100,00 | ||||
| 2025-11-14 | 13F | Wolverine Trading, Llc | Call | 20.100 | 63 | |||||
| 2026-02-11 | 13F | Capital International Investors | 27.415.434 | -11,69 | 101.163 | 5,11 | ||||
| 2026-02-09 | 13F | Coldstream Capital Management Inc | 11.970 | 0,00 | 44 | 18,92 | ||||
| 2026-02-10 | 13F | Acadian Asset Management Llc | 598.087 | 221,96 | 2 | |||||
| 2026-02-13 | 13F | Pinnacle Wealth Planning Services, Inc. | 9.232 | 34 | ||||||
| 2026-01-14 | 13F | Hennion & Walsh Asset Management, Inc. | 0 | -100,00 | 0 | -100,00 | ||||
| 2026-02-12 | 13F | Marex Group plc | 43.843 | -57,47 | 162 | -49,53 | ||||
| 2026-02-13 | 13F | American Century Companies Inc | 5.424.093 | 12,51 | 20.015 | 33,92 | ||||
| 2026-02-13 | 13F | Itau Unibanco Holding S.A. | 8.744.732 | -12,17 | 32.295 | 4,63 | ||||
| 2026-02-10 | 13F | Daiwa Securities Group Inc. | 97.536 | -34,77 | 0 | |||||
| 2026-01-14 | 13F | Jfs Wealth Advisors, Llc | 273 | 40,72 | 1 | |||||
| 2026-02-17 | 13F | Aquatic Capital Management LLC | 1.028.902 | 49,67 | 3.797 | 78,13 | ||||
| 2026-02-17 | 13F | Raymond James Financial Inc | 22.244 | 0,00 | 82 | 20,59 | ||||
| 2026-02-10 | 13F | Zhang Financial LLC | 11.695 | 0,00 | 43 | 19,44 | ||||
| 2025-11-10 | 13F | MAI Capital Management | 0 | -100,00 | 0 | -100,00 | ||||
| 2026-02-13 | 13F | Integrated Wealth Concepts LLC | 104.415 | 11,04 | 385 | 32,30 | ||||
| 2026-01-30 | 13F | North Star Investment Management Corp. | 2.520 | 0,00 | 9 | 28,57 | ||||
| 2026-02-05 | 13F | Tucker Asset Management Llc | 378 | 1 | ||||||
| 2026-02-06 | 13F | Pnc Financial Services Group, Inc. | 31.219 | -9,52 | 115 | 8,49 | ||||
| 2026-02-13 | 13F | JustInvest LLC | 48.279 | 5,69 | 178 | 26,24 | ||||
| 2026-02-12 | 13F | Commonwealth Equity Services, Llc | 285.259 | 1,65 | 1.053 | |||||
| 2026-01-05 | 13F | GAMMA Investing LLC | 2.685 | 12,63 | 10 | 28,57 | ||||
| 2026-02-13 | 13F | Contrarian Capital Management, L.l.c. | 19.069.112 | 0,00 | 70.365 | 19,03 | ||||
| 2026-03-26 | 13F | Leonteq Securities AG | Put | 0 | -100,00 | 0 | ||||
| 2026-02-03 | 13F | Ballentine Partners, LLC | 26.578 | 41,46 | 98 | 68,97 | ||||
| 2026-02-14 | 13F | Rockefeller Capital Management L.P. | 1.185 | -42,17 | 4 | -33,33 | ||||
| 2025-10-27 | 13F | First Horizon Corp | 0 | -100,00 | 0 | |||||
| 2026-02-13 | 13F | Morgan Stanley | 5.802.585 | -13,23 | 21.412 | 3,29 | ||||
| 2026-02-12 | 13F | Principal Securities, Inc. | 0 | -100,00 | 0 | |||||
| 2026-02-17 | 13F | Optiver Holding B.V. | 2.530.923 | -53,44 | 9.339 | -44,57 | ||||
| 2026-02-17 | 13F | Russell Investments Group, Ltd. | 869.699 | 3.235 | ||||||
| 2025-11-04 | 13F | Jones Financial Companies Lllp | 0 | -100,00 | 0 | |||||
| 2026-02-12 | 13F | Brown Brothers Harriman & Co | 818 | 3 | ||||||
| 2026-02-17 | 13F | Two Sigma Securities, Llc | 17.447 | 72,67 | 64 | 106,45 | ||||
| 2026-02-11 | 13F | Cerity Partners LLC | 35.990 | 22,51 | 133 | 45,05 | ||||
| 2026-02-12 | 13F | CoreCommodity Management, LLC | 48.408 | 0,00 | 179 | 18,67 | ||||
| 2026-01-23 | 13F | Robeco Institutional Asset Management B.V. | 80.595 | -69,28 | 297 | -63,47 | ||||
| 2026-02-10 | 13F | Eurizon Capital SGR S.p.A. | 2.893 | 11 | ||||||
| 2026-02-13 | 13F | State Street Corp | 3.531.028 | 5,70 | 13.029 | 25,82 | ||||
| 2026-01-26 | 13F | Mirae Asset Global Investments Co., Ltd. | 70.202 | 1,36 | 259 | 21,03 | ||||
| 2026-01-21 | 13F | Sowell Financial Services LLC | 33.377 | 3,09 | 123 | 23,00 | ||||
| 2026-02-17 | 13F | Jump Financial, LLC | 2.005.343 | 7.400 | ||||||
| 2026-02-17 | 13F | Dark Forest Capital Management Lp | 0 | -100,00 | 0 | |||||
| 2026-01-30 | 13F | Us Bancorp \de\ | 9.401 | 0,00 | 35 | 17,24 | ||||
| 2026-02-19 | 13F | CI Private Wealth, LLC | 28.394 | -0,64 | 104 | 17,05 | ||||
| 2026-02-17 | 13F | United Capital Financial Advisers, Llc | 11.792 | 44 | ||||||
| 2026-01-27 | 13F | WealthCollab, LLC | 1.035 | 0,00 | 4 | 0,00 | ||||
| 2026-02-10 | 13F | Connor, Clark & Lunn Investment Management Ltd. | 719.207 | -15,55 | 2.654 | 0,49 | ||||
| 2026-02-17 | 13F | Creative Planning | 263.111 | 76,99 | 971 | 110,87 | ||||
| 2026-01-30 | 13F | Mitsubishi UFJ Trust & Banking Corp | 26.455 | -8,32 | 98 | 8,99 | ||||
| 2026-01-23 | 13F | Farther Finance Advisors, LLC | 1.404 | 3.800,00 | 5 | |||||
| 2026-02-17 | 13F | Ancora Advisors, LLC | 65 | 0 | ||||||
| 2026-01-16 | 13F | Ronald Blue Trust, Inc. | 1.828 | -72,29 | 7 | -70,00 | ||||
| 2026-02-13 | 13F | Aigen Investment Management, Lp | 19.304 | -52,54 | 71 | -43,65 | ||||
| 2026-02-13 | 13F | Van Eck Associates Corp | 833.545 | -34,48 | 3 | 0,00 | ||||
| 2025-10-27 | 13F | Sumitomo Mitsui Trust Holdings, Inc. | 0 | -100,00 | 0 | -100,00 | ||||
| 2026-02-09 | 13F | Fisher Asset Management, LLC | 406.181 | 0,30 | 1.499 | 19,36 | ||||
| 2026-02-18 | 13F | Vident Advisory, LLC | 133.851 | 29,89 | 494 | 54,55 | ||||
| 2026-02-10 | 13F | Greenspring Advisors, LLC | 10.906 | 40 | ||||||
| 2026-02-13 | 13F | Squarepoint Ops LLC | 105.813 | -68,05 | 390 | -61,99 | ||||
| 2026-02-12 | 13F | Sagil Capital Llp | 0 | -100,00 | 0 | |||||
| 2026-01-30 | 13F | Sigma Planning Corp | 17.325 | 0,42 | 64 | 18,87 | ||||
| 2026-01-23 | 13F | Assetmark, Inc | 920 | 0,00 | 3 | 50,00 | ||||
| 2026-01-30 | 13F | R Squared Ltd | 0 | -100,00 | 0 | |||||
| 2026-02-17 | 13F | CWM Advisors, LLC | 26.397 | 10,96 | 97 | 32,88 | ||||
| 2026-03-11 | 13F | Leonteq Securities AG | 0 | -100,00 | 0 | |||||
| 2026-02-17 | 13F | PharVision Advisers, LLC | 27.308 | 23,74 | 101 | 47,06 | ||||
| 2026-02-12 | 13F | Provida Pension Fund Administrator | 0 | -100,00 | 0 | |||||
| 2026-03-04 | 13F | Rehmann Capital Advisory Group | 0 | -100,00 | 0 | |||||
| 2025-09-29 | NP | PXH - Invesco FTSE RAFI Emerging Markets ETF This fund is a listed as child fund of Invesco Ltd. and if that institution has disclosed ownership in this security, then these positions will not be double counted when calculating total shares and total value | 1.341.354 | 28,71 | 4.035 | 46,21 | ||||
| 2026-01-29 | 13F | UBS Group AG | 3.034.398 | 45,11 | 11.197 | 72,72 | ||||
| 2026-02-10 | 13F | Goldman Sachs Group Inc | 2.626.041 | -49,62 | 9.690 | -40,03 | ||||
| 2026-01-28 | 13F | CAPROCK Group, Inc. | 58.540 | -14,45 | 216 | 2,86 | ||||
| 2026-01-13 | 13F | Regatta Capital Group, Llc | 0 | -100,00 | 0 | |||||
| 2026-02-17 | 13F | Qube Research & Technologies Ltd | 0 | -100,00 | 0 | |||||
| 2026-02-17 | 13F | Royal Bank Of Canada | 6.691 | -31,49 | 25 | -19,35 | ||||
| 2026-02-13 | 13F | Barclays Plc | 0 | -100,00 | 0 | |||||
| 2026-02-02 | 13F | Qrg Capital Management, Inc. | 26.904 | -43,19 | 99 | -32,19 | ||||
| 2025-11-07 | 13F/A | Abn Amro Investment Solutions | 49.854 | -68,36 | 238 | -71,17 | ||||
| 2026-02-24 | 13F | Bell Investment Advisors, Inc | 187 | -37,25 | 1 | |||||
| 2026-02-11 | 13F | Ramirez Asset Management, Inc. | 543 | 2 | ||||||
| 2026-02-17 | 13F | Bank Of America Corp /de/ | 115.043 | -99,28 | 425 | -99,14 | ||||
| 2026-02-11 | 13F | West Family Investments, Inc. | 28.168 | 0,00 | 104 | 18,39 | ||||
| 2026-02-03 | 13F | Sequoia Financial Advisors, LLC | 72.343 | 11,75 | 267 | 33,00 | ||||
| 2026-02-12 | 13F | Renaissance Technologies Llc | 6.211.324 | -42,79 | 22.920 | -31,90 | ||||
| 2026-02-17 | 13F | Fmr Llc | 98.651.805 | 15,66 | 364.025 | 37,67 | ||||
| 2025-11-14 | 13F/A | Skopos Labs, Inc. | 0 | -100,00 | 0 | |||||
| 2026-01-28 | 13F | Kapitalo Investimentos Ltda | 0 | -100,00 | 0 | |||||
| 2026-02-10 | 13F | Bnp Paribas Arbitrage, Sa | 75.751 | -57,70 | 280 | -49,73 | ||||
| 2026-02-17 | 13F | Tudor Investment Corp Et Al | 24.638 | 91 | ||||||
| 2025-12-18 | 13F | AIA Group Ltd | 0 | -100,00 | 0 | -100,00 | ||||
| 2026-02-11 | 13F | Jpmorgan Chase & Co | 185.306 | -22,35 | 684 | -7,58 | ||||
| 2025-11-06 | 13F | Wealthstream Advisors, Inc. | 10.391 | 32 | ||||||
| 2026-02-11 | 13F | Capital Group Investment Management Pte. Ltd. | 117.331 | -9,85 | 433 | 7,20 | ||||
| 2025-11-12 | 13F | Creekmur Asset Management LLC | 0 | 0 | ||||||
| 2026-02-10 | 13F | Sivia Capital Partners, LLC | 15.549 | -10,73 | 57 | 7,55 | ||||
| 2026-02-11 | 13F | Capital International Ltd /ca/ | 527.933 | -10,03 | 1.948 | 7,09 | ||||
| 2026-01-22 | 13F | Massachusetts Financial Services Co /ma/ | 1.327.066 | 41,11 | 4.897 | 67,96 | ||||
| 2026-02-17 | 13F | Two Sigma Advisers, Lp | 525.580 | -83,67 | 1.939 | -80,57 | ||||
| 2026-02-12 | 13F | Dimensional Fund Advisors Lp | 12.059.942 | 0,13 | 44.510 | 19,21 | ||||
| 2026-02-06 | 13F | Addison Advisors LLC | 250 | 0,00 | 1 | |||||
| 2026-02-17 | 13F | Farringdon Capital, Ltd. | 0 | -100,00 | 0 | |||||
| 2026-02-10 | 13F | State of Wyoming | 24.228 | 230,17 | 89 | 304,55 | ||||
| 2025-09-29 | NP | AIM INTERNATIONAL MUTUAL FUNDS (INVESCO INTERNATIONAL MUTUAL FUNDS) - Invesco Oppenheimer Global Multi-Asset Growth Fund Class R6 | 10.100 | 320,83 | 30 | 400,00 | ||||
| 2026-02-13 | 13F | Centiva Capital, LP | 0 | -100,00 | 0 | |||||
| 2026-02-13 | 13F | Caitong International Asset Management Co., Ltd | 2 | -99,98 | 0 | -100,00 | ||||
| 2026-01-30 | 13F | ARGA Investment Management, LP | 241.625 | -4,26 | 892 | 13,94 | ||||
| 2026-02-17 | 13F | Capstone Financial Advisors, Inc. | 10.000 | 0,00 | 37 | 16,13 | ||||
| 2025-11-14 | 13F | Wetherby Asset Management Inc | 0 | -100,00 | 0 | |||||
| 2026-02-17 | 13F | Northern Trust Corp | 1.017.007 | 3,75 | 3.753 | 23,50 | ||||
| 2026-01-29 | 13F | Vanguard Group Inc | 2.199.360 | -32,44 | 8.116 | -19,59 | ||||
| 2025-11-12 | 13F | LPL Financial LLC | 0 | -100,00 | 0 | -100,00 | ||||
| 2026-02-12 | 13F | Banco BTG Pactual S.A. | 0 | -100,00 | 0 | -100,00 | ||||
| 2026-02-13 | 13F | VPR Management LLC | 86.242 | 0,00 | 318 | 19,10 | ||||
| 2026-02-17 | 13F | Aqr Capital Management Llc | 272.723 | 36,22 | 1.006 | 62,26 | ||||
| 2026-02-17 | 13F | Millennium Management Llc | 3.505.150 | 72,68 | 12.934 | 105,56 | ||||
| 2026-02-06 | 13F | Banque Cantonale Vaudoise | 800.000 | 2.952 | ||||||
| 2025-10-23 | 13F | SG Americas Securities, LLC | 0 | -100,00 | 0 | |||||
| 2026-02-17 | 13F | Point72 Asset Management, L.P. | 2.072.395 | 447,38 | 7.647 | 551,92 | ||||
| 2026-02-13 | 13F | SPX Equities Gestao de Recursos Ltda | 4.894.496 | 8,98 | 18.061 | 29,72 | ||||
| 2026-02-05 | 13F | Allworth Financial LP | 1.616 | -73,08 | 6 | -72,22 | ||||
| 2026-02-13 | 13F | Wells Fargo & Company/mn | 22.733 | -12,39 | 84 | 3,75 | ||||
| 2026-02-12 | 13F | Federation des caisses Desjardins du Quebec | 756 | -50,00 | 3 | -50,00 | ||||
| 2026-01-23 | 13F | BSW Wealth Partners | 53.697 | 4,74 | 198 | 25,32 | ||||
| 2025-11-14 | 13F | Cubist Systematic Strategies, LLC | 925.457 | -52,51 | 2.869 | -49,60 | ||||
| 2026-02-17 | 13F | Advisor Group Holdings, Inc. | 0 | -100,00 | 0 | |||||
| 2026-02-17 | 13F | MIRAE ASSET GLOBAL ETFS HOLDINGS Ltd. | 11.319 | 47,34 | 42 | 78,26 | ||||
| 2026-02-17 | 13F | XTX Topco Ltd | 588.619 | 86,84 | 2.172 | 122,54 | ||||
| 2026-01-20 | 13F | Stratos Wealth Partners, LTD. | 88.200 | 0,00 | 325 | 19,05 | ||||
| 2026-02-13 | 13F | Sei Investments Co | 282.193 | 268,10 | 1.041 | 339,24 | ||||
| 2025-11-06 | 13F | Advisors Asset Management, Inc. | 0 | -100,00 | 0 | |||||
| 2026-02-05 | 13F | LGT Group Foundation | 58.160 | 0,00 | 216 | 18,03 | ||||
| 2026-02-06 | 13F | Heritage Investors Management Corp | 0 | -100,00 | 0 | |||||
| 2026-01-16 | 13F | FNY Investment Advisers, LLC | Call | 0 | -100,00 | 0 | ||||
| 2026-02-11 | 13F | O'shaughnessy Asset Management, Llc | 14.415 | 8,77 | 53 | 29,27 | ||||
| 2025-11-14 | 13F | Citadel Advisors Llc | Call | 0 | -100,00 | 0 | -100,00 | |||
| 2026-02-13 | 13F | Pathstone Holdings, LLC | 41.401 | 27,40 | 153 | 52,00 | ||||
| 2026-02-13 | 13F | Neuberger Berman Group LLC | 192.899 | -9,89 | 712 | 7,24 | ||||
| 2026-02-13 | 13F | Toroso Investments, LLC | 150.552 | 6,39 | 556 | 26,71 | ||||
| 2026-01-20 | 13F | Signaturefd, Llc | 16.701 | -0,26 | 62 | 19,61 | ||||
| 2026-02-13 | 13F | Inspire Advisors, LLC | 45.249 | -3,01 | 167 | 15,28 | ||||
| 2026-02-05 | 13F | Cambridge Investment Research Advisors, Inc. | 38.717 | -45,44 | 0 | |||||
| 2026-01-28 | 13F | Aquamarine Financial (Cayman) Ltd | 19.526.171 | 9,69 | 72.052 | 30,57 | ||||
| 2026-01-21 | 13F | Kawa Capital Management, Inc | 0 | -100,00 | 0 | |||||
| 2026-01-08 | 13F | True Wealth Design, LLC | 80 | 0,00 | 0 | |||||
| 2026-02-17 | 13F | Private Advisor Group, LLC | 11.060 | 0,13 | 41 | 17,65 | ||||
| 2026-02-17 | 13F | Two Sigma Investments, Lp | 3.751.067 | -49,93 | 13.841 | -40,40 | ||||
| 2026-02-18 | 13F | Mackenzie Financial Corp | 4.117.253 | 80,57 | 15.286 | 116,27 | ||||
| 2026-02-11 | 13F | Parallel Advisors, LLC | 14.355 | 3,86 | 53 | 23,81 | ||||
| 2026-02-17 | 13F | Schonfeld Strategic Advisors LLC | 545.963 | -57,35 | 2.015 | -49,24 | ||||
| 2026-02-17 | 13F | Public Employees Retirement System Of Ohio | 15.076 | 56 | ||||||
| 2026-02-17 | 13F | Guggenheim Capital Llc | 406.644 | 2,28 | 1.501 | 21,75 | ||||
| 2026-02-13 | 13F | Rhumbline Advisers | 41.639 | -12,47 | 154 | 4,08 | ||||
| 2026-02-02 | 13F | Danske Bank A/s | 1 | 0,00 | 0 | |||||
| 2025-11-12 | 13F | Banco Santander, S.A. | 0 | -100,00 | 0 | -100,00 | ||||
| 2026-02-17 | 13F | Balyasny Asset Management Llc | 0 | -100,00 | 0 | |||||
| 2025-11-12 | 13F/A | Norges Bank | 0 | -100,00 | 0 | |||||
| 2026-02-11 | 13F | Donald Smith & Co., Inc. | 24.211.588 | 49,18 | 89.341 | 77,58 | ||||
| 2026-02-09 | 13F | Legal & General Group Plc | 840.628 | 0,00 | 3.098 | 19,07 | ||||
| 2026-02-17 | 13F/A | RBF Capital, LLC | 90.000 | 0,00 | 332 | 19,00 | ||||
| 2026-02-03 | 13F | Ethic Inc. | 297.228 | 19,53 | 1.097 | 42,34 | ||||
| 2026-02-12 | 13F | Jane Street Group, Llc | 1.251.423 | 4.618 | ||||||
| 2025-10-23 | 13F | Park Avenue Securities Llc | 0 | -100,00 | 0 | |||||
| 2026-02-13 | 13F/A | Virtus ETF Advisers LLC | 0 | -100,00 | 0 | |||||
| 2026-02-09 | 13F | Huntington National Bank | 1 | 0,00 | 0 | |||||
| 2026-02-17 | 13F | Citadel Advisors Llc | Put | 23.200 | -10,77 | 86 | 6,25 | |||
| 2025-11-12 | 13F | Abacus Wealth Partners, LLC | 0 | -100,00 | 0 | |||||
| 2026-02-11 | 13F | Group One Trading, L.p. | Put | 5.700 | -3,39 | 21 | 16,67 | |||
| 2026-02-13 | 13F | National Bank Of Canada /fi/ | 17.131 | 6,59 | 63 | 28,57 | ||||
| 2026-02-11 | 13F | Group One Trading, L.p. | 11.390 | 42 | ||||||
| 2026-02-17 | 13F | Aster Capital Management (DIFC) Ltd | 0 | -100,00 | 0 | |||||
| 2026-01-08 | 13F | Tuttle Tactical Management LLC | 31.986 | 118 |